Given the absence of any inclination toward the mystic arts of clairvoyance in any typical human being, to be able to predict with acute accuracy the path a stock price should take in its future is deemed immediately a near impossibility by most of us. Nevertheless, it shouldn't hurt any of us for attempting such a feat with the aid of technical indicators, a commonly used example of which being Bollinger Bands.

Analysing Stock Charts Using Bollinger Bands
by drdsol92
A few things to know about one of the more useful indicators in the technical analysis of stock prices
What are Bollinger Bands?
A Bollinger band is established two standard deviations away from a simple moving average, either above or below it. In most cases, the price of a stock is contained within the pair of Bollinger bands, with the simple moving average tracing the major trend it is pursuing at the time.
Interpreting Bollinger Bands
Volatility of a price within a particular period can be accessed simply by noting the distance between the two Bollinger bands. A narrowing of the bands (otherwise known as a Bollinger band squeeze) would suggest that the stock price is undergoing a reduction in volatility, i.e. it will oscillate only within the bounds defined by the Bollinger bands during the period said occurrence of band narrowing is observed.
On the other hand, an expansion of the Bollinger bands would allude to a drastic change in the stock price, either for the better or worse.
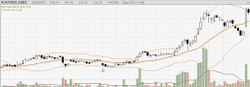
 Stock Chart of Hua Yang Berhad |
Examples of a Bollinger Band Squeeze and Expansion
Above is a stock chart pertaining to the price movements of Hua Yang Berhad, a Malaysian company. As you can see, there was an observable Bollinger band squeeze occurring within the confines of late January and early March, before it ended with a Bollinger band expansion, within which the stock price started to climb along the upper band. Note that the expansion occurring during the course of March preceded a subsequent expansion in April, which marked the continuation of the uptrend till the price reached its peak in the middle of the month.
What are Tags?
In the same chart, note that the beginning of the Bollinger band expansion coincided with a slight touch on the upper band, which can also be observed during the beginning of the second expansion. Brief moves to either Bollinger bands are called tags. Usually, they would indicate a strengthening momentum in whatever price trend they are found in. In the case of the Hua Yang stock price, they happen to be an indication of a continuation of the uptrend for both months they are observed in.
 Stock Chart of IGB Corporation Berhad |
More Bollinger Band Signals: W-Bottoms and M-Tops
W-bottoms and M-tops usually can be found in a consolidated price pattern, i.e. during a Bollinger band squeeze. W-bottoms occur in an uptrend, while M-tops in a downtrend, both useful in determining a drastic price change, at least most of the time. A W-bottom, which is employed to predict a bullish move in the price, is characterized by a price low which usually touches the lower band, a pull back to the middle band, and a subsequent price low which does not touch the lower band, whereas an M-top, used to predict a bearish price move, can be identified by a price high that touches the upper band, a pull back to the middle band, and a subsequent price high which does not touch the upper band.
Above is a stock chart presenting the price movements of IGB Corporation Berhad, a Malaysian company as well. In late June, there is a price high pressing against the upper Bollinger band, then a price withdrawal to the middle band in early July, and a second price high that fails to reach the upper band: all the conditions to form an M-top. A bearish price move is confirmed by the price breaking through the support price level of around 2.70 and a bearish tag signalling the strengthening momentum of an upcoming downtrend.
The third condition of an M-top, that the second price high does not touch the upper Bollinger band, points to the fact that the momentum of the uptrend it is found in is weakening. In this case, the faltering progression of price highs would suggest that the price is now tending toward a downtrend.
 Stock Chart of DIGI Telecommunications |
You can find two examples of a W-bottom in this next stock chart of DIGI, a Malaysian telecommunications company. A price low occurred in the middle of March, touching the lower Bollinger band, followed by a withdrawal to the middle band and a subsequent price low in early April, which fails to touch the lower band. A resistance break occurred in the beginning of May, though only briefly as the price faltered back to the middle band. In mid-May, you can see a price low hovering around the lower band, then a pull back to the middle band in the beginning of June, and finally a small dip from the peak only a few days away, the price low observed to be nowhere near the lower band: all the conditions satisfied for a second W-bottom. The bullish signal is only then confirmed by an immediate resistance break and a bullish tag found in mid-June.
The third condition of a W-bottom, that the second price low does not touch the lower Bollinger band, alludes to a weakening in the downtrend at the time; in the case of the second W-top in the stock chart, which happens to be a more apparent example on the bullishness of the W-top, the downtrend it is observed in weakens as the stock price tends toward an imminent upsurge, as can be seen from the growing progression of price lows.
Keep in mind that the Bollinger bands, and whatever signals it may provide, are in no way a means to predict future price moves with absolute accuracy. It is usually recommended to use it in conjunction with other indicators, such as the MACD indicator (Moving Average Convergence-Divergence), as two or more indicators would confirm more accurately the nature of a future price move than one alone.
Updated: 05/08/2013, drdsol92
You might also like
July 15th 2013 The Hostess Twinkie Makes The Sweetest Comeback...Hostess will be back and the stock and on your local store shelves this July ...
Best Money Saving TipsEffective money saving tips which are common sense but useful.
Disclosure: This page generates income for authors based on affiliate relationships with our partners, including Amazon, Google and others.


Comments
I'm always interested in learning more about stocks, I used to trade commodities oh about ten years ago, I got out when the markets began to get shaky. Since then I've had thoughts of stocks in the back of my mind as I know it's a great opportunity to learn about and practice with knowledge backing you. Great Post! Thanks