
What about the stock market?
by puerdycat
Did you ever want to de-mystify the stock market? Can't be all that complicated! and it isn't. Nobody even has to get a head-ache here.
When the "Dow Jones" is wild
it's a good day to learn about the Stock Market
When headlines make it sound like a financial HURRICANE is brewing, it's a great day to learn about the stock market. There's nothing like getting involved to help you learn. If you just happen to be reading about stocks on a really, really bad day, there's going to be a lot of information to hear, a lot of opinions of "how this happened." If you stick with it you WILL start building your own perspective.
Just starting out? Let's GO TO the Dow Jones Average graph. Select "5y" to set the graph, and put today's news into perspective. Look at ups and downs over a 5-year period. You can see that over the last five years there's been lots of jiggling up and down, and what happened in late 2008/early2009 made a much bigger jiggle.
Pay attention to what's in the news about different industries and the world. Oil stocks made a difference in the Dow Jones average on August 4, 2011. Oil "spiked" in February, but on the fourth it had fallen. I, personally, welcomed lower oil prices!
 Hurricane Mitch |
How to Read a Graph
Want a lesson about how to read a graph?
Here it is! There's also a database and an Atlas of Maps on this site.
Have you tinkered with the stock market?
Starting from scratch. Learn from watching the graph
You can look at weeks, months, or years of stock market activity.
It looks little like chicken scratch, but you can learn alot looking at the Dow Jones Average on the internet. You can adjust the chart to look at weeks, months, or years of stock market activity.
See what happened today (or the last day the markets were open). Check the numbers on the right side of the chart. In late-July 2011 (the day I started this page) the Dow Jones Average was in the 12,000's, and it bounced around between 12,600 and 12,700. In July I asked you to think about it, and if 100 points would make much difference. Today December 5 the Dow closed at 12,150, but you have to look at the graph (or read the news) so see that a lot has been happening since July.
Get a feel for what's here. I go to the SUMMARY in left column on our "Dow" page. The "Headlines" will take you to articles that catch your interest. Index Components are the individual stocks that make up the Dow Jones Average, and you can read about them. Lately the banks and the oil stocks are pretty active. Getting the idea of how to move around here?
When I discovered this chart, I loved looking at the stock market over the years. I was curious about the Depression like a lot of us. I followed the price of oil stocks, and how the price has bobbled up and down a lot. I was there in the 80s and saw lots of people lose their shirts when the price of gas crashed. So you can imagine that the price of oil gets my attention.
Are you in business? or do you work for a business? What will get your curiosity?
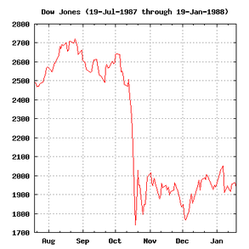
My own experience, July 1987 to January 1988
"Sweet" crude oil at over $30 a barrel in the mid 1980s, had everybody going wild. The bottom fell out, and oil fell to $13 a barrel
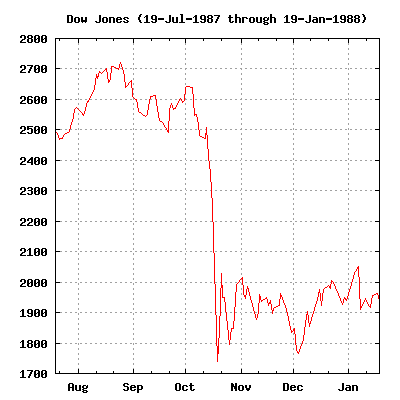 Dow Jones Average July 19, 1987 - Jan... |
So, what do you think?
Do those 100 points make much difference?
If you don't feel sure about your answer, don't worry. Nobody's ever sure about the stock market, but you WILL get a sense of what matters. How do you do that? By watching the chart and reading the news. You don't have to stay glued to the chart; you can adjust the chart to see weeks, months, or years of stock market activity.
Spoiler warning: you will find there's lots of this little squiggling up and down with little impact. You might want to look at the chart, read some in-depth articles, watching how the stock market activity get's reported. We hear, "AhhH, The market is upppP! or Ohhhh, the market's DOWnnnn." I'll bet you're getting an idea of what a 100-point drop in the Dow Jones Average might mean.
Round and Round we go!
AAA, to AA, to AAA -- In little more than a week, the US credit rating is back to AAA

Friday, August 12, 2011, after a week of hyper headlines, of hearing about a "volitile market" reacting to the AA downgrade, the Dow average wasn't doing too bad. In fact, only 170 points down for the whole week of up-and-down swings. Monday down 635 points, Tuesday up 420, Wednesday, down 520 points, Thursday up 420 points. More than one trader called it the "craziest week ever," but it's a matter of perspective. You've got to go to more than one Rodeo, as they say in Denver.
Tuesday, August 16, 2011. With the US credit rating returned to AAA, the Dow Jones average rebounded to over 14,400 -- just a little lower than where it started before "the trouble."
NEW YORK (Reuters) - Fitch Ratings said on Tuesday, that it gave the United States' a top-notch credit rating, AAA, giving a reprieve to the world's largest economy, after it had been downgraded by Standard & Poor's about a week earlier [ Read more at www.reuters.com ]
Monday, August 29, 2011. After all is said and done what happened on the stock market was more like the swirl in the bathroom sink than what we were afraid of. Look-ee-here, the DJIA (Dow Jones Industrial Average) is right where it was bouncing around before the trouble! Let's look at the Wall Street Journal's report on today's Dow average. If you like, you can follow WSJ on twitter at @WSJ .
at close Last Change % Chg
DJIA 11539.25 + 254.71 2.26
The NAME of the next WEATHER HURRICANE should start with a "J" ~ How about "Jones" ? "HOW HURRICANES ARE NAMED" ~ http://geology.com/hurricanes/hurricane-names.shtml
The graph applies to life
The markets aren't mysterious. Just take a direct look. It's what I did and it's what I trust you, too, can learn from. Learn about the periodic ups-and-downs called "the business cycle." Have you noticed that every 5 or 10 years or so everything is booming, followed by a slow down and then another boom?
The graph is a reflection of history! Choose a time-period to see how the charts looked at a time in history. 5 years (5y) can give you a perspective. I like to go far back, so I hit "max," click and hold the mouse, and pull the chart back to the 1920s, before the Depression. You don't have to go that far back. See can see peaks and craters in business cycles since 1970. The US quit backing the dollar with gold. The Vietnam war tapered off. Oil was still booming into the 80s. Then came the internet. The Berlin Wall fell. Much is written about what these events meant to the value of the dollar. It's interesting to see how world events, economics and politics interplay, how one affects the other.
and your experience
If you are just getting started, it won't take long before you've got an opinion about the experts.
About looking up and learning new terms. Everybody has they're own set of knowledge. What one person knows the next person better look up. I have fun with this. My preferred method is going to Google and typing in "define," say, "average." Define Dow Jones. Define Bonanza. Define gusher. Define stock market crash. Define Black Tuesday. This is what you get for "Black Tuesday": October 29th, 1929. This is the date of the most famous stock market crash in history.
Define Paul Krugman? I read his twitter. Which brings up something important. What's important to you doesn't have to be important to anybody else. Who knows what mysteries belong to you. Who knows what inner light will lead you. Whatever you do with this, I DO KNOW you can have a wonderful time. Please come back and tell me about your experience!
Oh, here's a point of view ...
"Stop Coddling the Rich"
Warren E. Buffet spoke about the "breaks" he and his rich friends get.
"My friends and I have been coddled long enough by a billionaire-friendly Congress. It’s time for our government to get serious about shared sacrifice."
"While the poor and middle class fight for us in Afghanistan, and while most Americans struggle to make ends meet, we mega-rich continue to get our extraordinary tax breaks. Some of us ... earn billions ... but are allowed ... a bargain 15 percent tax rate. Others own stock index futures for 10 minutes and have most their gain taxed at 15%."
That "owning for 10 minutes" thing bothers me. A friend showed me the computer program he uses to make money this way. He just waits for two lines to cross. He doesn't think about how he is raising the price we pay for our gasoline ... or other ways he affects everyone.
Warren E. Buffet's article was published August 12, 2011, in the New York Times
You might also like
Planning for Grad SchoolHow to search for the best academic institution re your professional goals an...
How to Write Publishable Academic ArticlesGetting academic articles published is not an easy task. I give you the basic...

 Snow for Christmason 12/05/2011
 We all want to communicateon 10/11/2011
 Joel Meyerowitzon 06/14/2011


While were looking for your mittens, your muffler and your warm coat, you wanted to tell me ...