
There is a geographic difference in vaccination rates when examined by state. Of the 50 US states plus the District of Columbia, 13 of these had vaccination rates below the stated public health goal of 90%. Nine of these states are in the western half of the country. Montana (85.1%) had the lowest MMR vaccination rate, followed by Utah (85.5%), Nevada (87.0%), Idaho (87.2%), Arizona (87.7%), Alaska (88.4%), New Mexico (88.8%), Colorado (89.3%) and Washington (89.8%). Only two are located in the Northeast - New Jersey (86.1%) and New York (89.3%). In the South, Louisiana (89.5%) has the lowest MMR vaccination rate. In the Southeast, Kentucky (89.5%) is the lowest.
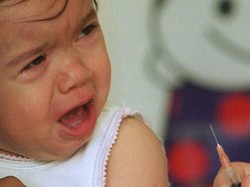
Childhood Vaccination Rates Remain High in the United States
Over 90% of children between the ages of 19 and 35 months receive vaccinations in accordance with CDC guidelines.
Despite the fears of a very vocal minority of parents, who not only refuse to have their children vaccinated, but see a government conspiracy in the requirements, childhood immunizations are on the rise. For the oldest and well-known vaccinations such as the polio vaccination, immunization rates are above 90%. In fact less than 1% of children, only 0.6% of the children in the United States receive no vaccinations. For the United States as a whole, polio vaccination is at 93%; measles, mumps, and rubella (MMR) is at 92%, chicken pox (varicella) is at 91% and the diphtheria, tetanus, and pertussis (whooping cough) is at 96%.
MMR Vacination Rates by State
MMR States with under a 90% vaccination rate
13 of the 50 US States have less than 90% of their children vaccinated for measles, mumps and rubella.
- Montana 85.1%46.98357447158638, -109.140625
- Utah 85.5%39.099742010883965, -111.513671875
- New Jersey 86.1%39.558637417041695, -74.88525390625
- Nevada 87.0%39.60943978423624, -116.7431640625
- Idaho 87.0%43.29674449772617, -114.1064453125
- Arizona 87.7%34.20220055780077, -111.8212890625
- Alaska 88.4%60.52455367497995, -149.7021484375
- New Mexico 88.8%33.54545323948051, -106.1083984375
- Colorado 89.3%38.79214086234757, -105.8447265625
- New York 89.3%42.71830990107444, -75.3466796875
- Kentucky 89.537.33909600430495, -85.2783203125
- Louisiana30.263273173535048, -92.0458984375
- Washington 89.847.013545909155475, -120.5224609375
Childhood Vaccination Coverage for the Modified Series
While all states had reached at least 85% coverage for the MMR vaccination. The modified vaccine series varies from Nevada (61.3%) to Wisconsin (82.7%). Across the United States, when state residence is not taken into account, 72.7% of children have received the modified vaccine series. The series as defined by the CDC includes ≥4 doses DTP/DT/DTaP vaccine (diphtheria, tetanus toxoids, and pertussis vaccine; diphtheria and tetanus toxoids vaccine; and diphtheria, tetanus toxoids, and acellular pertussis vaccine), ≥3 doses of poliovirus vaccine, ≥1 dose of any measles-containing vaccine, ≥3 doses of HepB, ≥1 dose of varicella vaccine, and ≥4 doses of PCV. Haemophilus influenzae type b vaccine is excluded.
Only 4 states - Florida (81.0%), New Hampshire (81.0%), Michigan (81.3%) and Wisconsin (82.7%) are above 80% childhood vaccination rates for the modified vaccine series.
States Below the Modified Vaccine Series Average of 72.7% Coverage
- Nevada 61.3%39.71093275755924, -116.787109375
- New Jersey 62.6%39.541695019153266, -74.79736328125
- Oklahoma 62.9%35.303409594247164, -97.3193359375
- New York 64.1%42.79897371444616, -76.2255859375
- West Virginia38.25926009201923, -80.9716796875
- Wyoming 64.7%42.92781736636295, -107.9541015625
- Montana 64.9%46.968582448215464, -108.8330078125
- Maryland 65.9%39.439953772237715, -77.1923828125
- Alaska 66.1%58.986500085467455, -145.37353515625
- Idaho 66.3%43.248749701952335, -114.08447265625
- South Dakota 67.0%44.39017131607953, -100.28564453125
- Missouri 67.9%38.190214120592586, -92.46337890625
- Colorado 68.3%38.80926481851399, -105.82275390625
- New Mexico 68.3%33.63697000609865, -106.26220703125
- Kentucky 68.9%37.216709459326765, -85.08056640625
- Utah 69.5%38.87771948567753, -111.79931640625
- Vermont 69.7%43.75874219531291, -72.95166015625
- Louisiana 70.9%30.206322086578655, -91.40869140625
- Texas 70.9%31.48904589833766, -99.31884765625
- California 70.1%37.006441399288626, -119.62158203125
- Arizona 71.1%34.365595926886314, -111.79931640625
- Washington 71.2%46.66785910209309, -120.58837890625
- Indiana 71.6%39.69402761333625, -86.22314453125
- Delaware 71.9%38.82638465946852, -75.54443359375
- Alabama 72.4%32.16113487776324, -86.640625
How does the CDC collect this childhood vaccination data.
The National Immunization Survey (NIS) is based on information collected quarterly through a randomized phone survey. So there could be a bias towards households that have landlines and against those that do not. It is followed by a mail survey to the vaccination providers. For the 2010 NIS, 63.8% of households answered the questions. Vaccination providers returned vaccination records for 71.2% of all children with completed household interviews, for a total of 17,004 children.
Comments
MladenApr 2, 2012
If we expect to eradicate diseases such as Polio, diphtheria and others, then vaccination is the only way to do it. If one is not vaccinated, he can be source of infection and carrier in the future. These ones would be threat to others who weren't able to get vaccinated by some other medical conditions.
katiem2Apr 2, 2012
lakeerieartistsApr 2, 2012